
Athletic trainers demonstrate using a body bag to cool down an athlete suffering from heat illness during a drill at Seacrest Field, Friday, Aug. 5, 2022.

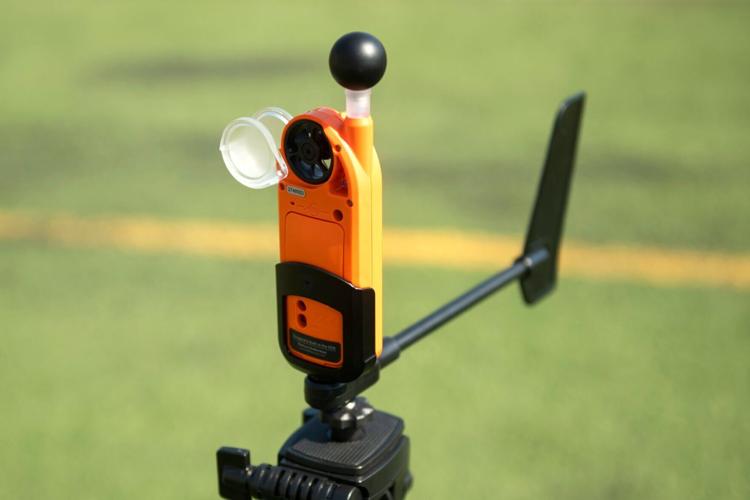
A wet bulb globe, a device used to monitor heat stress, will be available to athletic trainers at Nebraska high schools this year.
People are also reading…

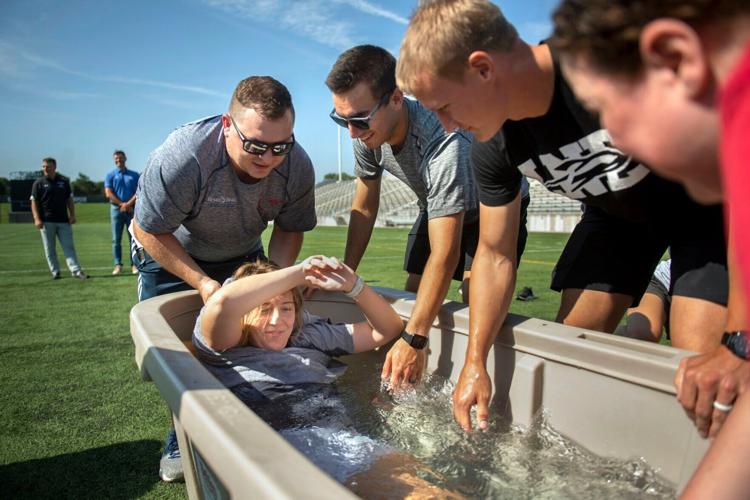
Nebraska Wesleyan athletic training student Sabrina Ochterbeck is placed in an ice bath by athletic trainers (from left) Terry Adair of Bryan Health, Tyler Rediger of Lincoln Southeast, Bryan Butler of Lincoln Northeast and Charity Rainey of Lincoln High on Friday. With fall practice set to begin Monday, athletic trainers reviewed how to prevent and treat heat illnesses.
Breaking down Lincoln's public schools: Enrollment, test scores and more
Adams

Adams Elementary: 7401 Jacobs Creek Drive
Enrollment: 829 students
76.6% white, 3.2% African-American, 8.7% Asian, 5.5% Hispanic, 6% two or more races
Free and reduced-price lunch participation: 10% free, 2.3% reduced
Gifted students: 8.9%
Statewide test scores (percent who meet or exceed standards): 78 language arts; 77 math; 88 science
Arnold

Arnold Elementary: 5000 Mike Scholl St.
Enrollment: 776 students
64.6% white, 0.6% Native, 5.3% African-American, 1.3% Asian, 17% Hispanic, 11.3% two or more races
Free and reduced-price lunch participation: 46.4% free, 17.1% reduced
Gifted: 3.5%
Statewide test scores (percent who meet or exceed standards): 60 language arts, 48 math, 68 science
Beattie

Beattie Elementary: 1901 Calvert St.
Enrollment: 394 students
78.7% white, 2.9% African-American, 1.1% Asian, 6.9% Hispanic, 10.4% two or more races
Free or reduced-price lunch participation: 23.1% free, 11.2% reduced price
Gifted: 7.2%
Statewide test scores (percent who meet or exceed standards): 70 language arts, 59 math, 78 science
Belmont

Belmont Elementary: 3425 N. 14th St.
Enrollment: 821 students
51.7% white, 0.4% Native, 11.8% African-American, 2.7% Asian, 23.6% Hispanic, 0.1% Native Hawaiian or Pacific Islander, 9.6% two or more races
Free and reduced-price lunch participation: 71.5% free, 11.1% reduced
Gifted: 2.5%
Statewide test scores (percent who meet or exceed standards): 59 language arts, 62 math, 53 science
Brownell

Brownell Elementary: 6000 Aylesworth Ave.
Enrollment: 335 students
68.5% white, 0.6% Native, 4.1% African-American, 0.3% Asian, 13.6% Hispanic, 12.9% two or more races
Free and reduced-price lunch participation: 50.8% free, 12.6% reduced
Gifted: 3.5%
Statewide test scores (percent who meet or exceed standards): 52 language arts, 43 math, 50 science
Calvert

Calvert Elementary: 3709 S. 46th St.
Enrollment: 363 students
63.8% white, 0.6% Native, 7.1% African-American, 0.6% Asian, 13.9% Hispanic, 0.3% Native Hawaiian or Pacific Islander, 13.6% two or more races
Free and reduced-price lunch participation: 46.3% free, 10.7% reduced
Gifted: 9.8%
Statewide test scores (percent who meet or exceed standards): 55 language arts, 47 math, 62 science
Campbell

Campbell Elementary: 2200 Dodge St.
Enrollment: 655 students
60.4% white, 1.2% Native, 10.4% African-American, 8.4% Asian, 11.9% Hispanic, 7.6% two or more races
Free and reduced-price lunch participation: 57.6% free, 9.3% reduced
Gifted: 3.6%
Statewide test scores (percent who meet or exceed standards): 50 language arts, 38 math, 52 science
Cavett

Cavett Elementary: 7701 S. 36th St.
Enrollment: 636 students
82.6% white, 2.1% African-American, 4.2% Asian, 6.4% Hispanic, 4.7% two or more races
Free and reduced-price lunch participation: 10.1% free, 3.9% reduced
Gifted: 14.8%
Statewide test scores (percent who meet or exceed standards): 79 language arts, 80 math, 84 science
Clinton

Clinton Elementary: 1520 N. 29th St.
Enrollment: 444 students
39.5% white, 1.3% Native, 28.1% African-American, 3.3% Asian, 20.3% Hispanic, 7.4% two or more races
Free and reduced-price lunch participation: 86.6% free, 7.6% reduced
Gifted: 3.1%
Statewide test scores (percent who meet or exceed standards): 34 language arts, 28 math, 27 science
Eastridge

Eastridge Elementary: 6245 L St.
Enrollment: 291 students
74.4% white, 0.3% Native, 3.5% African-American, 2.9% Asian, 9.6% Hispanic, 9.3% two or more races
Free and reduced-price lunch participation: 29.5% free, 10.3% reduced
Gifted: 4.2%
Statewide test scores (percent who meet or exceed standards): 71 language arts, 64 math, 85 science
Elliott

Elliott Elementary: 225 S. 25th St.
Enrollment: 398 students
28.4% white, 2% Native, 11.4% African-American, 19.6% Asian, 24.1% Hispanic, 14.5% two or more races
Free and reduced-price lunch participation: 79.5% free, 7.1% reduced
Gifted: 3.1%
Statewide test scores (percentage who meet or exceed standards): 35 language arts, 29 math, 30 science
Everett

Everett Elementary: 1123 C St.
Enrollment: 449 students
31.7% white, 1% Native, 11.1% African-American, 9.1% Asian, 38.3% Hispanic, 8.8% two or more races
Free and reduced-price lunch participation: 81.6% free, 9.1% reduced
Gifted: 1.8%
Statewide test scores (percentage who meet or exceed standards): 39 language arts, 39 math, 55 science
Fredstrom

Fredstrom Elementary, 5700 N.W. 10th St.
Enrollment: 469 students
78.7% white, 0.2% Native, 1.3% African-American, 1.9% Asian, 6.7% Hispanic, 0.2% Native Hawaiian or Pacific Islander, 11% two or more races
Free and reduced-price lunch participation: 17.8% free, 11.6% reduced
Gifted: 7.5%
Statewide test scores (percentage who meet or exceed standards): 72 language arts, 70 math, 79 science
Hartley

Hartley Elementary, 730 N. 33rd St.
Enrollment: 394 students
40.9% white, 1.3% Native, 18.2% African-American, 3.4% Asian, 25.1% Hispanic, 0.5% Native Hawaiian or Pacific Islander, 10.6% two or more races
Free and reduced-price lunch participation: 79.4% free, 7.1% reduced
Gifted: 2.4%
Statewide test scores (percentage who meet or exceed standards): 34 language arts, 31 math, 35 science
Hill

Hill Elementary, 5230 Tipperary Trail
Enrollment: 527 students
72.7% white, 0.8% Native, 2.5% African-American, 1.5% Asian, 9.4% Hispanic, 13.1% two or more races
Free and reduced-price lunch participation: 25.5% free, 6.9% reduced
Gifted: 11.9%
Statewide test scores (percentage who meet or exceed standards): 74 language arts, 62 math, 83 science
Holmes

Holmes Elementary, 5230 Sumner St.
Enrollment: 416 students
70.4% white, 4.2% African-American, 2.3% Asian, 10.7% Hispanic, 0.3 Native Hawaiian or Pacific Islander, 12.1% two or more races
Free and reduced-price lunch participation: 42.8% free, 9.6% reduced
Gifted: 3.1%
Statewide test scores (percentage who meet or exceed standards): 60 language arts, 64 math, 72 science
Humann

Humann Elementary, 6720 Rockwood Lane
Enrollment: 530 students
79.8% white, 0.6% Native, 3.3% African-American, 1.4% Asian, 5.6% Hispanic, 0.2% Native Hawaiian or Pacific Islander, 9.1% two or more races
Free and reduced-price lunch participation: 20.2% free, 5% reduced
Gifted: 9.5%
Statewide test scores (percentage who meet or exceed standards): 74 language arts, 69 math, 80 science
Huntington

Huntington Elementary, 2900 N. 46th St.
Enrollment: 456 students
51.5% white, 1.3% Native, 14% African-American, 0.7% Asian, 15.9% Hispanic, 0.2% Native Hawaiian or Pacific Islander, 16.4% two or more races
Free and reduced-price lunch participation: 69.7% free, 14.2% reduced
Gifted: 2.4%
Statewide test scores (percentage who meet or exceed standards): 39 language arts, 37 math, 59 science
Kahoa

Kahoa Elementary, 7700 Leighton Ave.
Enrollment: 582 students
83.2% white, 0.2% Native, 1.8% African-American, 2.8% Asian, 6% Hispanic, 6.1% two or more races
Free and reduced-price lunch participation: 21.1% free, 6.5% reduced
Gifted: 6.1%
Statewide test scores (percentage who meet or exceed standards): 74 language arts, 71 math, 86 science
Kloefkorn

Kloefkorn Elementary, 6601 Glass Ridge Drive
Enrollment: 484 students
85.5% white, 0.4% Native, 1.5% African-American, 5.7% Asian, 4.2% Hispanic, 2.6% two or more races
Free and reduced-price lunch participation: 4.8% free, 2.2% reduced
Gifted: 12.1%
Statewide test scores (percentage who meet or exceed standards): 82 language arts, 78 math, 80 science
Kooser

Kooser Elementary, 7301 N. 13th St.
Enrollment: 777 students
65.9% white, 5.3% African-American, 10.2% Asian, 8.7% Hispanic, 9.8% two or more races
Free and reduced-price lunch participation: 31.1% free, 8.3% reduced
Gifted: 5.8%
Statewide test scores (percentage who meet or exceed standards): 65 language arts, 64 math, 79 science
Lakeview

Lakeview Elementary, 300 Capitol Beach Blvd.
Enrollment: 380 students
51.3% white, 0.5% Native, 14.4% African-American, 5.4% Asian, 19.5% Hispanic, 9% two or more races
Free and reduced-price lunch participation: 64.6% free, 9% reduced
Gifted: 3.6%
Statewide test scores (percentage who meet or exceed standards): 44 language arts, 40 math, 57 science
Maxey

Maxey Elementary, 5200 S. 75th St.
Enrollment: 683 students
80.7% white, 1.4% African-American, 9.9% Asian, 4% Hispanic, 4.1% two or more races
Free and reduced-price lunch participation: 9.4% free, 2.7% reduced
Gifted: 9.7%
Statewide test scores (percentage who meet or exceed standards): 78 language arts, 73 math, 86 science
McPhee

McPhee Elementary, 820 Goodhue Blvd.
Enrollment: 301 students
23.9% white, 0.4% Native, 18.3% African-American, 17.5% Asian, 32.1% Hispanic and 7.8% two or more races
Free and reduced-price lunch participation: 83.6% free, 6.7% reduced
Gifted: 3.7%
Statewide test scores (percentage who meet or exceed standards): 33 language arts, 20 math, 35 science
Meadow Lane

Meadow Lane Elementary, 7200 Vine St.
Enrollment: 611 students
70.8% white, 0.2% Native, 4% African-American, 3.6% Asian, 11.6% Hispanic, 9.7% two or more races
Free and reduced-price lunch participation: 34.2% free, 10.6% reduced
Gifted: 5.7%
Statewide test scores (percentage who meet or exceed standards): 59 language arts, 60 math, 69 science
Morley

Morley Elementary, 6800 Monterey Drive
Enrollment: 476 students
81.6% white, 3.6% African-American, 1.6% Asian, 5.9% Hispanic, 7.3% two or more races
Free and reduced-price lunch participation: 20.2% free, 4.8% reduced
Gifted: 12.7%
Statewide test scores (percentage who meet or exceed standards): 72 language arts, 66 math, 75 science
Norwood Park

Norwood Park Elementary, 4710 N. 72nd St.
Enrollment: 262 students
65.2% white, 1.2% Native, 4.9% African-American, 1.6% Asian, 17.4% Hispanic, 9.7% two or more races
Free and reduced-price lunch participation: 61.5% free, 12.6% reduced
Gifted: 3.6%
Statewide test scores (percentage who meet or exceed standards): 50 language arts, 38 math, 71 science
Pershing

Pershing Elementary, 6402 Judson St.
Enrollment: 471 students
69% white, 0.5% Native, 3.9% African-American, 1.5% Asian, 15.8% Hispanic, 9.4% two or more races
Free and reduced-price lunch participation: 58.9% free, 12.1% reduced
Gifted: 4.7%
Statewide test scores (percentage who meet or exceed standards): 53 language arts, 45 math, 61 science
Prescott

Prescott Elementary, 1930 S. 20th St.
Enrollment: 471 students
46.9% white, 1.4% Native, 8.6% African-American, 10.9% Asian, 14.2% Hispanic, 0.6% Native Hawaiian or Pacific Islander, 17.3% two or more races
Free and reduced-price lunch participation: 61.3% free, 9.1% reduced
Gifted: 7%
Statewide test scores (percentage who meet or exceed standards): 50 language arts, 37 math, 54 science
Pyrtle

Pyrtle Elementary, 721 Cottonwood Drive
Enrollment: 470 students
79.9% white, 1.2% African-American, 1.7% Asian, 9.3% Hispanic, 7.9% two or more races
Free and reduced-price lunch participation: 18.9% free, 8.8% reduced
Gifted: 9.8%
Statewide test scores (percentage who meet or exceed standards): 73 language arts, 69 math, 83 science
Randolph

Randolph Elementary, 1024 S. 37th St.
Enrollment: 481 students
64.5% white, 0.6% Native, 5.4% African-American, 3.4% Asian, 15.8% Hispanic, 10.4% two or more races
Free and reduced-lunch participation: 51.3% free, 10% reduced
Gifted: 4.8%
Statewide test scores (percentage who meet or exceed standards): 70 language arts, 54 math, 82 science
Riley

Riley Elementary, 5021 Orchard St.
Enrollment: 336 students
62.4% white, 5.3% African-American, 4.7% Asian, 17.7% Hispanic, 9.9% two or more races
Free and reduced-price lunch participation: 47.2% free, 11.2% reduced
Gifted: 5%
Statewide test scores (percentage who meet or exceed standards): 51 language arts, 41 math, 46 science
Roper

Roper Elementary, 2323 S. Coddington
Enrollment: 884 students
62.1% white, 0.2% Native, 8.6% African-American, 4.3% Asian, 17.2% Hispanic, 7.6% two or more races
Free and reduced-price lunch participation: 43% free, 10.1% reduced
Gifted: 5.1%
Statewide test scores (percentage who meet or exceed standards): 54 language arts, 53 math, 67 science
Rousseau

Rousseau Elementary, 3701 S 33rd St.
Enrollment: 573 students
78.2% white, 3.1% African-American, 1.6% Asian, 9.2% Hispanic, 0.2% Native Hawaiian or Pacific Islander, 7.7% two or more races
Free and reduced-price lunch participation: 24.3% free, 8.3% reduced
Gifted: 12.9%
Statewide test scores (percentage who meet or exceed standards): 75 language arts, 72 math, 88 science
Saratoga

Saratoga Elementary, 2215 S. 13th St.
Enrollment: 271 students
48.1% white, 3.4% Native, 10.1% African-American, 3.4% Asian, 23.6% Hispanic, 11.4% two or more races
Free and reduced-price lunch participation: 71.3% free, 8.9% reduced
Gifted: 4.2%
Statewide test scores (percentage who meet or exceed standards): 41 language arts, 33 math, 65 science
Sheridan

Sheridan Elementary, 3100 Plymouth Ave.
Enrollment: 489 students
83.6% white, 1.5% African-American, 1.1% Asian, 6.1% Hispanic, 7.6% two or more races
Free and reduced-price lunch participation: 15.5% free, 4.4% reduced
Gifted: 17.5%
Statewide test scores (percentage who meet or exceed standards): 80 language arts, 69 math, 86 science
West Lincoln

West Lincoln Elementary, 630 W. Dawes Ave.
Enrollment: 524 students
43.2% white, 0.4% Native, 9.4% African-American, 1.6% Asian, 38.3% Hispanic, 0.4% Native Hawaiian or Pacific Islander, 6.8% two or more races
Free and reduced-price lunch participation: 71.3% free, 11.9% reduced
Gifted: 3.3%
Statewide test scores (percentage who meet or exceed standards): 42 language arts, 34 math, 46 science
Wysong

Wysong Elementary, 7901 Blanchard Blvd.
Enrollment: 542 students
92.7% white, 0.2% Native, 0.2% African-American, 0.4% Asian, 3.2% Hispanic, 3.2% two or more races
Free and reduced-price lunch participation: 2.6% free, 1.8% reduced
Gifted: 3.2%
Statewide test scores (percentage who meet or exceed standards): 82 language arts, 82 math, 81 science
Zeman

Zeman Elementary, 4900 S. 52nd St.
Enrollment: 433 students
66.7% white, 0.5% Native, 5.3% African-American, 3.2% Asian, 14.6% Hispanic, 9.7% two or more races
Free and reduced-price lunch participation: 33.7% free, 13.3% reduced
Gifted: 6.3%
Statewide test scores (percentage who meet or exceed standards): 64 language arts, 53 math, 85 science
Culler

Culler Middle School, 5201 Vine St.
Enrollment: 634 students
49.4% white, 1.2% Native, 12.5% African-American, 5.9% Asian, 23.1% Hispanic, 0.2% Native Hawaiian or Pacific Islander, 7.8% two or more races
Free and reduced-price lunch participation: 72.1% free, 8.7% reduced
Gifted: 6.6%
Statewide test scores (percentage who meet or exceed standards): 34 language arts, 31 math, 47 science
Dawes

Dawes Middle School, 5130 Colfax Ave.
Enrollment: 450 students
61.7% white, 0.6% Native, 7.8% African-American, 1.7% Asian, 14% Hispanic, 14.2% two or more races
Free and reduced-price lunch participation: 54.3% free, 11.6% reduced
Gifted: 13.7%
Statewide test scores (percentage who meet or exceed standards): 45 language arts, 41 math, 60 science
Goodrich

Goodrich Middle School, 4600 Lewis Ave.
Enrollment: 886 students
50% white, 0.4% Native, 12% African-American, 5.5% Asian, 24.5% Hispanic, 0.1% Native Hawaiian or Pacific Islander, 7.5% two or more races
Free and reduced-price lunch participation: 71.5% free, 8.2% reduced
Gifted: 8.4%
Statewide test scores (percentage who meet or exceed standards): 41 language arts, 43 math, 67 science
Irving

Irving Middle School, 2745 S. 22nd St.
Enrollment: 828 students
65.5% white, 0.4% Native, 5.9% African-American, 3.7% Asian, 13.2% Hispanic, 0.1% Native Hawaiian or Pacific Islander, 11.2% two or more races
Free and reduced-price lunch participation: 34.5% free, 8.7% reduced
Gifted: 28.2%
Statewide test scores (percentage who meet or exceed standards): 65 language arts, 61 math, 70 science
Lefler

Lefler Middle School, 1100 S. 48th St.
Enrollment: 575 students
58.9% white, 1.4% Native, 9.5% African-American, 3.9% Asian, 13% Hispanic, 0.2% Native Hawaiian or Pacific Islander, 13.2% two or more races
Free and reduced-price lunch participation: 52.6% free, 7.3% reduced
Gifted: 15.1%
Statewide test scores (percentage who meet or exceed standards): 55 language arts, 52 math, 65 science
Lux

Lux Middle School, 7800 High St.
Enrollment: 790 students
79% white, 0.1% Native, 1.8% African-American, 5.7% Asian, 7.1% Hispanic, 0.1% Native Hawaiian or Pacific Islander, 6.2% two or more races
Free and reduced-price lunch participation: 15.6% free, 4.4% reduced
Gifted: 32%
Statewide test scores (percentage who meet or exceed standards): 78 language arts, 79 math, 83 science
Mickle

Mickle Middle School, 2500 N. 67th St.
Enrollment: 732 students
78.4% white, 0.7% Native, 4% African-American, 1.3% Asian, 9.7% Hispanic, 5.9% two or more races
Free and reduced-price lunch participation: 37% free, 9.4% reduced
Gifted: 19.4%
Statewide test scores (percentage who meet or exceed standards): 50 language arts, 51 math, 64 science
Moore

Moore Middle School, 8700 Yankee Woods Drive
Enrollment: 612 students
84.2% white, 0.2% Native, 2.1% African-American, 4% Asian, 6.5% Hispanic, 3.1% two or more races
Free and reduced-price lunch participation: 7.1% free, 2.5% reduced
Gifted: 26.9%
Statewide test scores (percentage who meet or exceed standards): 72 language arts, 73 math, 76 science
Park

Park Middle School, 855 S. Eighth St.
Enrollment: 834 students
47.4% white, 0.7% Native, 11.6% African-American, 8.4% Asian, 23.7% Hispanic, 8.2% two or more races
Free and reduced-price lunch participation: 59.6% free, 9.5% reduced
Gifted: 10.5%
Statewide test scores (percentage who meet or exceed standards): 41 language arts, 47 math, 48 science
Pound

Pound Middle School, 4740 S. 45th St.
Enrollment: 727 students
75.1% white, 0.7% Native, 3.9% African-American, 1.7% Asian, 10.4% Hispanic, 0.3% Native Hawaiian or Pacific Islander, 8% two or more races
Free and reduced-price lunch participation: 26.6% free, 9.1% reduced
Gifted: 24.3%
Statewide test scores (percentage who meet or exceed standards): 70 language arts, 70 math, 78 science
Schoo

Schoo Middle School, 700 Penrose Drive
Enrollment: 916 students
71% white, 0.6% Native, 4.5% African-American, 3.8% Asian, 11% Hispanic, 9% two or more races
Free and reduced-price lunch participation: 32.1% free, 9.9% reduced
Gifted: 13.5%
Statewide test scores (percentage who meet or exceed standards): 57 language arts, 59 math, 73 science
East

East High School, 1000 S. 70th St.
Enrollment: 2,311 students
82% white, 0.4% Native, 2.3% African-American, 3.5% Asian, 7.4% Hispanic, 4.5% two or more races
Free and reduced-price lunch participation: 17% free, 5% reduced
Gifted: 21.8%
Statewide test scores (percentage who meet or exceed standards): 63 language arts, 67 math, 68 science
Lincoln High

Lincoln High School, 2229 J St.
Enrollment: 2,362 students
46% white, 1.5% Native, 11.4% African-American, 10.2% Asian, 21.4% Hispanic, 0.1% Native Hawaiian or Pacific Islander, 9.4% two or more races
Free and reduced-price lunch participation: 51.8% free, 8.3% reduced
Gifted: 17.4%
Statewide test scores (percentage who meet or exceed standards): 39 language arts, 39 math, 42 science
Northeast

Northeast High School, 2635 N. 63rd St.
Enrollment: 1,779 students
62.8% white, 1% Native, 9% African-American, 3.3% Asian, 14.7% Hispanic, 0.1% Native Hawaiian or Pacific Islander, 9.2% two or more races
Free and reduced-price lunch participation: 50.2% free, 10.4% reduced
Gifted: 9.2%
Statewide test scores (percentage who meet or exceed standards): 35 language arts, 32 math, 39 science
North Star

North Star High School, 5801 N. 33rd St.
Enrollment: 2,164 students
57.3% white, 0.8% Native, 7.9% African-American, 6.5% Asian, 20.8% Hispanic, 0.1% Native Hawaiian or Pacific Islander, 6.6% two or more races
Free and reduced-price lunch participation: 45% free, 10.5% reduced
Gifted: 9.1%
Statewide test scores (percentage who meet or exceed standards): 37 language arts, 36 math, 39 science
Southeast

Southeast High School, 2930 S. 37th St.
Enrollment: 2,077 students
74.8% white, 1% Native, 3.9% African-American, 1.7% Asian, 10% Hispanic, 0.2% Native Hawaiian or Pacific Islander, 8.4% two or more races
Free and reduced-price lunch participation: 28% free, 7.9% reduced
Gifted: 19.7% gifted
Statewide test scores (percentage who meet or exceed standards): 53 language arts, 56 math, 56 science
Southwest

Southwest High School, 7001 S. 14th St.
Enrollment: 2,055 students
79.1% white, 0.3% Native, 2.5% African-American, 4.1% Asian, 8.6% Hispanic, 5.2% two or more races
Free and reduced-price lunch participation: 15.4% free, 4.1% reduced
Gifted: 21.9%
Statewide test scores (percentage who meet or exceed standards): 63 language arts, 63 math, 72 science
Scott

Scott Middle School, 2200 Pine Lake Road
Enrollment: 1,113 students
81.1% white, 0.3% Native, 2.8% African-American, 3.9% Asian, 6.3% Hispanic, 5.6% two or more races
Free and reduced-price lunch participation: 12.8% free, 5.4% reduced
Gifted: 31%
Statewide test scores (percentage who meet or exceed standards): 73 language arts, 77 math, 88 science